


Most price charts are noisy. Every tick, wick, and minor pullback shows up on the screen. As a result, many traders struggle to see the real trend hiding underneath all that movement.
This is exactly where Renko charts help. They strip away small price changes and show only meaningful moves. Over two decades of studying and writing about markets, I have seen few tools simplify a chart as quickly as Renko does.
In this guide, you will get renko charts explained from the ground up. First, you will learn how the bricks work. Next, you will see how to set them up on TradingView step by step. Finally, we will cover brick sizing, practical strategy ideas, and the mistakes that trip up new users.
What Are Renko Charts?
Renko charts come from Japan. The name likely comes from "renga," the Japanese word for brick. Japanese rice traders reportedly used the method long before Western traders adopted it in the late 20th century.
Unlike candlestick charts, Renko ignores time. Instead, it focuses only on price movement. A new brick appears only when price moves a fixed amount, known as the brick size.
How Renko Bricks Form
The logic is simple. Suppose you set a brick size of $1 on a stock trading at $100.
- If price rises to $101, a new up brick (usually green or hollow) forms.
- If price then climbs to $102, another up brick prints.
- If price falls back to $101.50, nothing happens, because the move is smaller than one brick.
- However, a down brick needs a reversal of two bricks in most settings. So price must fall to $100 before a red brick appears.
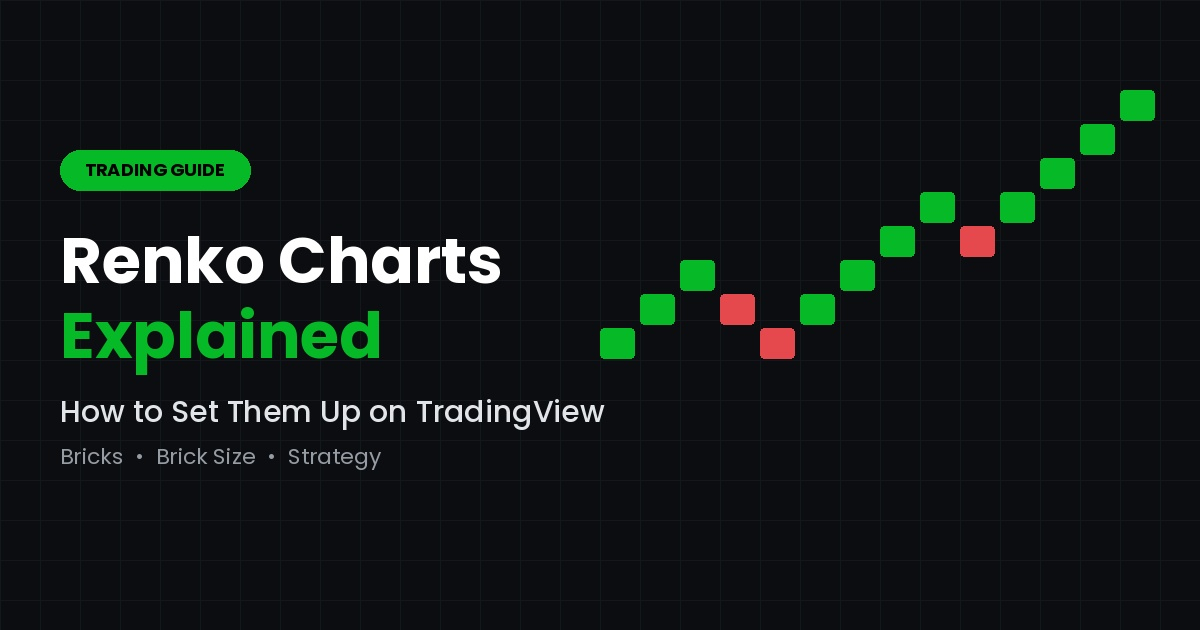
In other words, each brick sits at a 45-degree angle to the previous one. Moreover, no brick ever forms beside another in the same column. This creates the clean, staircase look that makes Renko so easy to read.
Because time is removed, one brick might take five minutes to form. Meanwhile, the next might take three days. That is normal, and it is actually the whole point.
Renko vs. Candlestick Charts
To truly have renko charts explained, you need to see how they differ from the charts you already use. Candlesticks show open, high, low, and close for every time period. Renko, on the other hand, shows only whether price has moved enough to matter.
Where Renko Shines
- Clearer trends. Long runs of same-colored bricks make trend direction obvious.
- Less noise. Small, meaningless fluctuations are filtered out automatically.
- Cleaner support and resistance. Horizontal levels often stand out more clearly.
- Simpler decisions. A color change is a visual cue that momentum may be shifting.
Where Renko Falls Short
No chart type is perfect. Therefore, it helps to know the trade-offs before you rely on Renko.
- Lag. A reversal brick needs a full move to print, so signals arrive late.
- Hidden detail. Wicks, gaps, and intraday spikes are often invisible.
- No time context. You cannot tell how long a move took just by looking.
- Repainting on live data. The last brick can change until it is complete, which matters for backtesting.
For these reasons, experienced traders rarely use Renko alone. Instead, they pair it with a standard chart for context.
How to Set Up Renko Charts on TradingView
TradingView makes Renko setup quick. Even so, a few settings deserve careful attention. Follow these steps in order.
- Open a chart. Log in to TradingView and load any symbol, such as a stock, forex pair, or crypto asset.
- Find the chart type menu. At the top toolbar, click the chart style icon. By default, it shows a candlestick symbol.
- Select Renko. Scroll through the list and choose "Renko." The chart will immediately redraw as bricks.
- Open the settings. Right-click the chart and pick "Settings," or click the gear icon. Then find the Renko inputs, usually under the Symbol tab.
- Choose a box size method. You will typically see two main options: ATR and Traditional. We will discuss which to use in the next section.
- Set the source. Pick whether bricks are built from closing prices or from highs and lows. Closing prices give a smoother, more conservative chart.
- Toggle wicks if needed. Turning wicks on shows how far price stretched before a brick closed. This restores some of the detail that Renko normally hides.
- Save your layout. Finally, save the chart layout so your settings load automatically next time.
A Quick Tip on Timeframes
Although Renko ignores time, the underlying data still matters. On TradingView, the timeframe you select controls which price data builds the bricks. Consequently, a 1-minute base often produces more accurate bricks than a daily base. If your chart looks strange, try switching to a lower timeframe first.
Choosing the Best Renko Brick Size
Brick size is the single most important Renko setting. Too small, and the chart fills with noise again. Too large, and you miss most of the move. So, what is the best renko brick size?
Honestly, there is no universal answer. The right size depends on the asset, its volatility, and your trading style. Still, two proven methods give you a solid starting point.
Traditional (Fixed) Brick Size
With the Traditional method, you set a fixed price value. For example, you might use $0.50 for a $50 stock or 10 pips for EUR/USD.
This approach is predictable and easy to understand. However, it does not adapt when volatility changes. A size that works in a quiet week may be far too small during a news-driven spike.
ATR-Based Brick Size
The ATR method uses the Average True Range to calculate brick size automatically. TradingView commonly defaults to a 14-period ATR.
As a result, brick size reflects recent volatility. Many traders consider this the best renko brick size approach for beginners, because it removes guesswork. Keep in mind, though, that ATR bricks are fixed when the chart loads. They can shift when you reload the chart with new data.
Practical Sizing Guidelines
To find the best renko brick size for your own trading, start with these rules of thumb:
- Day traders often use smaller bricks, roughly 0.1% to 0.25% of price.
- Swing traders usually prefer larger bricks, around 0.5% to 1% of price.
- Volatile assets such as crypto generally need bigger bricks than large-cap stocks.
- Test visually. Scroll back through several months of data. Ideally, trends should show clear runs, while choppy periods produce only a few alternating bricks.
Above all, keep the size consistent once you begin testing. Changing it after every trade makes your results impossible to evaluate.
Building a Renko Chart Trading Strategy
A chart type is not a strategy on its own. Instead, it is a lens. Below are three common frameworks that traders use to build a renko chart trading strategy. Treat them as starting points to test, not as guaranteed systems.
1. Trend-Following With Brick Streaks
This is the simplest approach. First, wait for a reversal brick that breaks a prior trend. Then, enter after two or three consecutive bricks confirm the new direction.
For exits, many traders close the position when the first opposite-colored brick appears. This keeps losses small and lets winners run during long trends.
2. Moving Average Filter
Adding a moving average helps reduce false signals. For instance, you can place a 20-period simple moving average on the Renko chart.
- Consider long trades only when bricks sit above the average.
- Consider short trades only when bricks sit below it.
- Avoid trading when bricks keep crossing back and forth.
Because Renko already smooths price, the average tends to be cleaner than on a candlestick chart. Consequently, crossovers are often easier to interpret.
3. Support and Resistance Breakouts
Renko charts make horizontal levels stand out. When several bricks stall at the same price, that level likely matters.
To trade it, wait for a brick to close beyond the level. Then, ideally, look for a second brick in the same direction before entering. Meanwhile, place your stop on the other side of the broken level.
Combining Renko With Indicators
Momentum tools like RSI or MACD can add confirmation to any renko chart trading strategy. Nevertheless, remember that indicators are calculated on brick data, not time data. Their readings will therefore differ from what you see on a standard chart. Always backtest before relying on them.
Common Mistakes to Avoid
Even experienced traders make errors with Renko. Fortunately, most are easy to fix once you know about them.
- Ignoring the lag. Renko confirms moves late. Therefore, expect to give back some profit at every reversal.
- Over-optimizing brick size. Tweaking the size until past results look perfect usually fails in live markets.
- Trusting the last brick. On live charts, the current brick is not final. Wait for it to close before acting.
- Skipping the time chart. Gaps and news spikes can hide inside a single brick. A quick look at candlesticks gives you that missing context.
- Unrealistic backtests. Renko backtests can look better than reality, because they assume fills at exact brick prices. Factor in slippage and spreads.
Managing Risk on Renko Charts
Risk management matters more than any entry signal. A practical rule is to risk no more than 1% to 2% of your account per trade.
In addition, Renko makes stop placement fairly intuitive. Many traders place stops two bricks beyond their entry, since that distance usually marks a confirmed reversal. Finally, keep a trading journal. Over time, it will show you which brick sizes and setups actually suit your style.
Final Thoughts
With renko charts explained step by step, you now understand how bricks form, how to configure them on TradingView, and how to choose a brick size that fits your market. Renko will not predict the future. However, it can make trends clearer and decisions calmer.
Start small and test one setup at a time. Likewise, compare every Renko signal against a standard chart before you act. Over time, you will learn whether a renko chart trading strategy truly fits your style.
At GainzAlgo, we believe traders benefit most when they understand the tools behind every signal. Many readers ask, "is gainzalgo legit?" The fairest way to judge any trading resource is the same way you should judge Renko itself: test it, review the evidence, manage your risk, and make decisions based on your own results.