

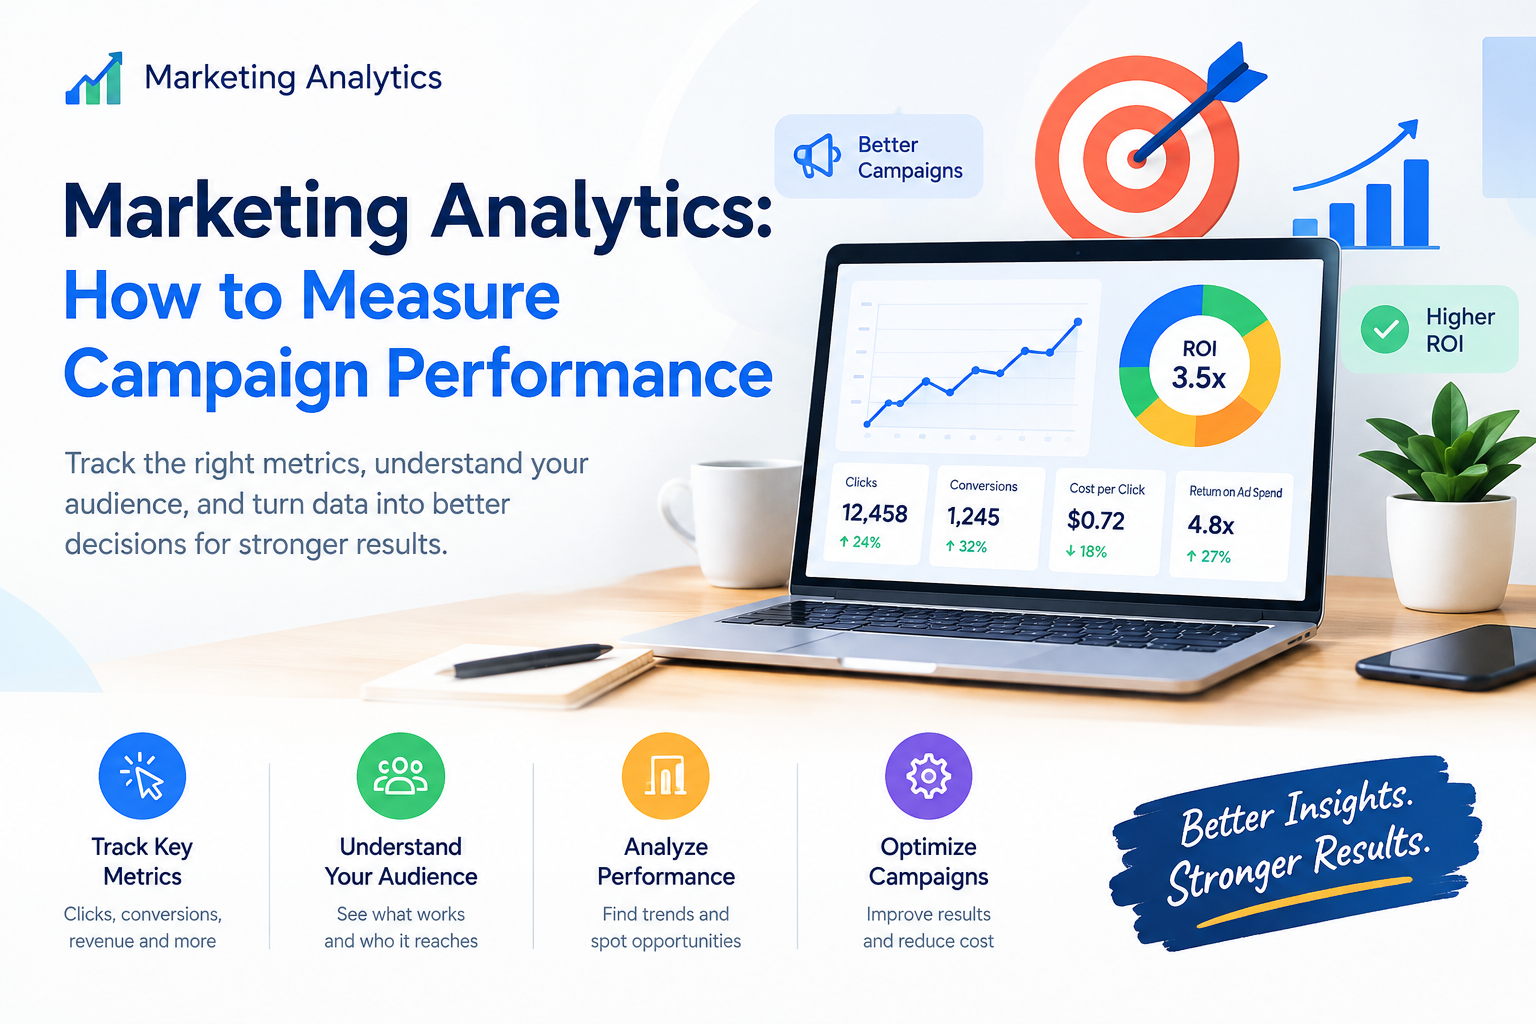
Marketing campaigns require more than creative ads and a good budget. Businesses need to understand which campaigns attract customers, generate sales, and deliver measurable returns. Without tracking results, marketers may continue spending money on ads that fail to meet their goals. Marketing data helps teams identify what works, where money is being wasted, and which opportunities deserve more attention. By using clear metrics and regular reporting, businesses can make better decisions and improve their advertising strategy. Marketing Analytics provides a practical way to measure campaign performance and connect marketing activities with business results.
What Is Marketing Analytics?
Marketing Analytics is the process of collecting, measuring, and analyzing data from marketing activities to understand their performance. It helps businesses evaluate campaigns across search engines, social media, email marketing, display advertising, and other digital channels.
For example, an online store might spend $2,000 on a paid advertising campaign. The campaign generates 100 orders and $6,000 in revenue. By reviewing this information, the marketing team can assess whether the campaign is producing enough value to justify its cost.
Analytics also helps businesses understand customer behavior. Marketers can identify which advertisements attract visitors, which landing pages encourage purchases, and where potential customers leave the buying process.
The goal is simple: use reliable data to make informed marketing decisions instead of relying on assumptions.
Why Measuring Campaign Performance Matters
Every marketing campaign should have a clear objective. Some campaigns aim to increase website traffic, while others focus on generating leads, increasing sales, or improving brand awareness.
Measuring performance helps businesses understand whether they are achieving those objectives. It also makes budget planning more effective because marketers can compare results across campaigns and channels.
Here are several important benefits:
- Better budget allocation: Invest more carefully in campaigns that meet business goals.
- Improved customer targeting: Identify audiences that respond positively to advertisements.
- Higher conversion rates: Find and address problems in landing pages or checkout processes.
- Clearer reporting: Share measurable results with business owners and marketing teams.
- Faster optimization: Adjust campaigns when performance changes.
For small businesses, these benefits can make a significant difference. Even a limited advertising budget can produce useful results when spending decisions are based on accurate information.
Key Metrics for Measuring Marketing Performance
Choosing the right metrics is essential for understanding campaign results. The best measurements depend on the campaign's objective, but several indicators are useful for most digital marketing activities.
1. Return on Ad Spend (ROAS)
Return on Ad Spend measures how much advertising revenue a campaign generates for every dollar spent on advertising.
The formula is:
ROAS = Revenue Attributed to Ads ÷ Advertising Cost
Suppose a business spends $1,500 on an advertising campaign and generates $6,000 in attributed revenue.
ROAS = $6,000 ÷ $1,500 = 4
The campaign achieves a 4:1 ROAS, meaning it generates $4 in revenue for every $1 spent on advertising.
A ROAS Calculator can simplify this calculation and help marketers compare campaigns without performing manual calculations each time.
However, a high ROAS does not automatically mean a business is profitable. Product costs, shipping, staff expenses, platform fees, and other operating costs also affect the final result.
2. Cost Per Acquisition (CPA)
Cost Per Acquisition measures how much a business spends to gain a customer or complete a defined conversion.
For example, if a company spends $900 on advertising and acquires 30 customers, its CPA is $30.
A lower CPA can improve campaign efficiency, provided the customers acquired generate enough value to support the business.
3. Conversion Rate
Conversion rate shows the percentage of visitors who complete a desired action, such as purchasing a product, submitting a form, or registering for a service.
If 1,000 people visit a landing page and 40 make a purchase, the conversion rate is 4%.
Tracking this metric helps marketers evaluate landing pages, offers, checkout processes, and audience quality.
4. Click-Through Rate (CTR)
Click-through rate measures the percentage of impressions that result in clicks.
If an advertisement receives 10,000 impressions and 250 clicks, its CTR is 2.5%.
A higher CTR may indicate that the advertisement is relevant to its audience. However, clicks alone do not prove that a campaign generates sales or profit.
5. Customer Acquisition Cost (CAC)
Customer Acquisition Cost measures the average cost of acquiring a new customer. Depending on the calculation, it may include advertising expenses, marketing software, agency fees, and relevant staff costs.
Businesses should define which expenses they include and apply that definition consistently when comparing results.
How to Measure Campaign Performance Step by Step
An effective measurement process does not need to be complicated. The important thing is to establish clear goals and use consistent tracking methods.
Step 1: Set a Clear Campaign Goal
Start by deciding what success means for the campaign. An online retailer may aim to increase purchases, while a service provider may focus on qualified leads.
Choose a measurable target, such as generating 100 leads or achieving a target ROAS within a specific period.
Step 2: Establish Your Baseline
Review previous campaign results before launching a new campaign. Record important metrics such as advertising spend, revenue, conversion rate, and CPA.
This baseline helps you determine whether the new campaign improves performance or simply produces similar results.
Step 3: Track Data Across Marketing Channels
Use suitable analytics and advertising platforms to monitor campaign activity. Google Analytics, advertising dashboards, and customer relationship management systems can provide different parts of the picture.
Set up conversion tracking correctly and use consistent campaign tagging, such as UTM parameters, to identify traffic sources.
Accurate tracking matters because incomplete or duplicated conversion data can lead to incorrect decisions.
Step 4: Calculate Advertising Profitability
Revenue is an important measurement, but it does not tell the whole story. Businesses must also consider the cost of delivering products or services.
For example, a campaign generates $8,000 in revenue after $2,000 in advertising costs. Its ROAS is 4:1. If product costs and other relevant expenses are high, the remaining profit may be much lower than expected.
Tools and resources from roascalculate can help marketers calculate ROAS and review advertising returns. Combine these calculations with margin data to gain a clearer understanding of advertising profitability.
Step 5: Compare Results and Make Adjustments
Review campaign results regularly, using the same measurement period and attribution approach wherever possible.
Compare audience segments, advertising creatives, landing pages, and channels. If one advertisement generates clicks but few conversions, investigate whether its message matches the landing page or customer expectations.
Make controlled adjustments and allow enough time to gather meaningful data before deciding whether a change has improved results.
The Role of Advertising & PPC in Campaign Analysis
Advertising & PPC campaigns provide detailed information about spending, impressions, clicks, and conversions. This data helps marketers understand how paid campaigns perform across different audiences and platforms.
However, comparing platforms requires care. Each platform may use different attribution windows, conversion definitions, and reporting methods. As a result, reported revenue may not match exactly across advertising dashboards and analytics tools.
To improve consistency, businesses should define a primary reporting source, verify conversion tracking, and use a consistent approach to campaign evaluation.
Marketers should also look beyond individual advertisements. A campaign may generate inexpensive clicks but attract visitors who are unlikely to purchase. Evaluating traffic quality alongside conversions provides a more useful picture of performance.
Common Marketing Analytics Mistakes to Avoid
Even experienced marketers can misinterpret campaign data when they focus on the wrong measurements.
Focusing Only on Clicks
Clicks show interest, but they do not necessarily lead to sales. Track conversions and business outcomes alongside traffic metrics.
Ignoring Profit Margins
A campaign may produce substantial revenue but still lose money after product costs and operating expenses. Consider margins when setting ROAS targets.
Making Decisions Too Early
Small samples can produce misleading results. Avoid making major budget changes based on a few clicks or conversions unless there is a clear technical problem or significant risk.
Using Inconsistent Data
Different reporting periods, attribution settings, and conversion definitions can distort comparisons. Standardize your reporting process and check data quality regularly.
Ignoring Customer Lifetime Value
Some customers make repeat purchases over time. Where reliable data is available, consider customer lifetime value alongside initial acquisition costs to understand the longer-term impact of campaigns.
A Practical Example of Campaign Optimization
Consider an online retailer running two campaigns during the same month.
Campaign A spends $1,000 and generates $3,000 in attributed revenue. Campaign B spends $1,000 and generates $4,500.
Campaign A achieves a 3:1 ROAS, while Campaign B achieves a 4.5:1 ROAS.
At first glance, Campaign B performs better. However, the retailer should also compare product margins, refund rates, customer quality, and the number of new customers acquired.
If Campaign B attracts repeat buyers and maintains healthy margins, increasing its budget may be a reasonable next step. If its sales mainly come from heavily discounted products, the business may need further analysis before investing more.
This example demonstrates why effective marketing analysis combines calculations with business context.
How to Build a Consistent Analytics Routine
A simple reporting routine can help businesses stay focused on their goals.
Review spending, conversions, and tracking accuracy regularly. Prepare a weekly report showing the most important campaign metrics. At the end of each month, compare results against targets and previous periods.
Keep reports focused on decisions rather than collecting every available metric. Each report should answer three questions: What happened? Why might it have happened? What should the team test or change next?
Over time, this approach creates a clearer record of campaign performance and helps teams learn from both successful and unsuccessful campaigns.
Conclusion
Marketing Analytics helps businesses understand whether their campaigns are generating meaningful results. By tracking ROAS, CPA, conversion rate, CTR, and customer acquisition costs, marketers can identify opportunities to improve spending and customer engagement.
The strongest approach combines accurate tracking, realistic targets, and regular performance reviews. A ROAS Calculator can make advertising return calculations easier, while a broader analysis of margins and customer behavior provides a more complete view of business performance.
With consistent measurement and thoughtful optimization, businesses can make better decisions, reduce wasted advertising spend, and build campaigns that support long-term growth.
FAQs
1. What is Marketing Analytics?
Marketing Analytics is the process of measuring and analyzing marketing data to evaluate campaign performance and improve business decisions.
2. What is ROAS in digital marketing?
ROAS measures the revenue attributed to advertising for every dollar spent on ads.
3. How do you calculate ROAS?
Divide the revenue attributed to advertising by the advertising cost. For example, $5,000 in revenue from $1,000 in ad spend equals a 5:1 ROAS.
4. Which metrics are most important for campaign performance?
Common metrics include ROAS, CPA, conversion rate, CTR, and customer acquisition cost. The best choices depend on campaign objectives.
5. How often should marketers review campaign data?
Marketers can monitor key metrics regularly, review performance weekly, and conduct a broader analysis monthly, adjusting the schedule to campaign volume and business needs.