

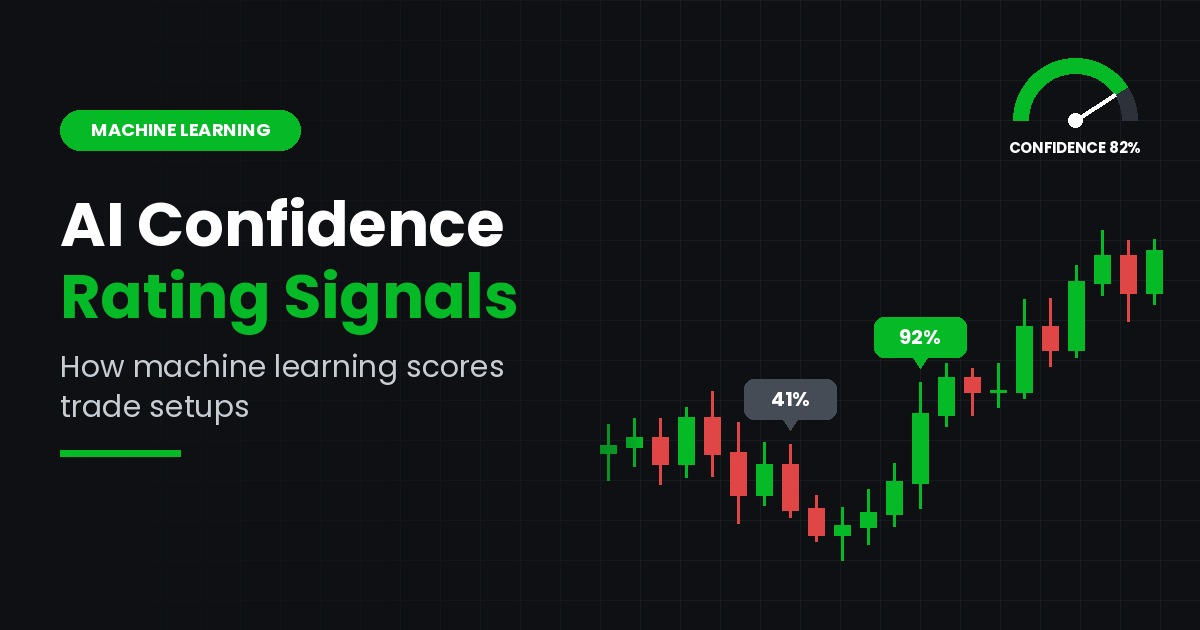
Confidence rating signals tell a trader how much weight a setup deserves before any money is at risk. Instead of a plain buy or sell arrow, each alert arrives with a score. That score reflects how closely current conditions match setups that worked in the past.
After two decades of watching traders chase every alert, I have seen one pattern repeat. Most losses do not come from bad strategies. Rather, they come from treating every signal as equal. A weak breakout in a choppy market gets the same position size as a clean trend continuation. Unsurprisingly, results suffer.
Machine learning offers a structured answer to that problem. In this guide, you will learn what confidence rating signals are and how models build the score. You will also see how trading signal strength and confluence trading fit into the picture. Equally important, you will learn where these scores fall short.
What Are Confidence Rating Signals?
Confidence rating signals are trade alerts paired with a score that estimates the quality of a setup. The score usually appears as a percentage, a 1–10 scale, or simple labels such as low, medium and high.
The idea behind it is simple. First, a model studies thousands of historical setups. Then, it compares the current setup against them. If similar conditions often led to follow-through, the score rises. If they often failed, the score drops.
However, a confidence score is not a guarantee. A 75% rating does not mean the trade will win three times out of four in your account. Instead, it means the model found strong agreement among the features it was trained to read. Those ideas are related, yet they are not the same.
Traditional indicators work differently. A moving average crossover, for example, is binary: either the lines crossed or they did not. By contrast, confidence rating signals add a second layer, which is how convincing that crossover looks in context. Volume, volatility, trend structure and recent price behavior are all weighed together.
As a result, two signals that look identical on a chart can receive very different scores. One might appear during a strong trend with rising volume. The other might appear in a flat, thin session. The score helps you tell them apart in seconds.
How Machine Learning Scores a Trade Setup
Most systems that produce confidence rating signals follow the same four stages: collect data, build features, train a model and calibrate the output.
- Data collection. The model is fed historical price, volume and, in some cases, order-flow data. Each past setup is labeled by its outcome, such as whether price reached a target before hitting a stop.
- Feature engineering. Raw prices are rarely useful on their own. Therefore, analysts convert them into features. Common examples include trend slope, distance from a moving average, ATR-based volatility, RSI readings, relative volume and time of day. Higher-timeframe direction is often added as well.
- Model training. Next, an algorithm learns which feature combinations tend to come before successful moves. Gradient-boosted trees and random forests are popular because they handle mixed data well. Neural networks are also used, especially for sequence patterns.
- Calibration. Raw model outputs are not always reliable probabilities. So, they are adjusted with methods such as Platt scaling or isotonic regression. Good calibration means setups scored at 70% actually succeeded close to 70% of the time in testing.
Throughout this process, validation matters most. A well-built model is tested on data it has never seen. Walk-forward testing is usually preferred, since markets change over time. In other words, the model is trained on one period, tested on the next, and then rolled forward.
Overfitting is the biggest danger here. A model can memorize noise and still look brilliant on past charts. Consequently, careful developers limit the number of features, rely on out-of-sample testing and report results that include losing periods.
Trading Signal Strength vs. Confidence: Not the Same Thing
Trading signal strength and confidence are often used as if they mean the same thing. In practice, however, they measure different parts of a setup.
Trading signal strength describes how forceful the underlying move is. For instance, a breakout on triple the average volume with a wide-range candle is a strong signal. It shows real conviction from market participants.
Confidence, on the other hand, describes how often similar setups have worked before. A strong signal can still carry low confidence. Consider a powerful breakout that runs straight into major resistance on a higher timeframe. The move looks aggressive, but history may show that it fails often.
The reverse is also true. A quiet pullback in a steady uptrend may look weak at first glance. Yet it can earn a high score, because such pullbacks have resolved upward many times before.
Better models therefore blend both ideas. Trading signal strength becomes one input among many rather than the final verdict. Meanwhile, the confidence score summarizes how all the inputs line up.
For a working trader, this distinction is practical. Strength tells you how loudly the market is speaking. Confidence tells you how often that kind of message has been worth acting on. Reading both together gives a far clearer picture than either one alone.
Confluence Trading: Where Human Logic Meets Machine Learning
Confluence trading means taking a trade only when several independent factors agree. Long before machine learning arrived, experienced traders used it to filter out noise.
A classic example uses three conditions. First, price sits at a known support zone. Second, momentum shows bullish divergence. Third, the higher-timeframe trend points up. Each factor alone is weak. Together, however, they build a much more convincing case.
Machine learning essentially automates confluence trading at scale. Instead of checking three factors by eye, a model can weigh dozens at once. Moreover, it learns how much each factor should count. Support may matter more in ranging markets, while trend alignment may matter more in strong trends.
There is an important catch, though. The factors must be truly independent. RSI, stochastic and CCI are all derived from price momentum. Stacking them is not real confluence; it is the same opinion repeated three times. Good models, like good traders, combine different families of evidence. Trend, momentum, volume, volatility and market structure each add something unique.
This is where confidence rating signals add the most value. When the score is high, several independent factors usually agree. When it is low, at least one key factor is pulling the other way. Seen this way, the score is a compact summary of confluence that can be read in a second.
How to Read and Use Confidence Scores in Practice
Confidence rating signals are most useful when they shape decisions you were already going to make. Here are practical ways experienced traders apply them.
- Set a minimum threshold. Many traders simply ignore alerts below a chosen score. This one rule reduces overtrading, especially in choppy sessions.
- Scale position size. Higher scores can justify slightly larger positions, while lower scores call for smaller ones. Even so, total risk per trade should stay within fixed limits, often 1–2% of account equity.
- Check the context. Look for major news, earnings or session opens nearby. Models trained on normal conditions may misread sudden volatility.
- Track your own results. Log every trade along with its score. After 50 to 100 trades, compare outcomes across score bands. If high scores do not beat low scores in your hands, something needs adjusting.
- Watch for score drift. Markets evolve. If high-confidence trades underperform for several weeks, the model may need retraining, or you may need a pause.
Additionally, keep timeframes in mind. A score generated on a 5-minute chart reflects short-term conditions only. It says little about where price will be next week. Matching the score's timeframe to your holding period avoids a lot of confusion.
Finally, remember that discipline still decides results. A high-confidence trade with a poorly placed stop can lose more than a medium-confidence trade managed well. In short, the score improves selection, but it does not replace risk management.
The Limits of AI Confidence Scores
No model behind confidence rating signals can see the future; every score is an estimate built on the past. Understanding these limits protects you from false certainty.
First, regime changes hurt models. A system trained mostly on trending years may struggle in long sideways markets. Likewise, sudden shocks such as surprise central bank decisions sit outside most training data.
Second, backtests can mislead. Results are sometimes shown without fees, slippage or realistic fills. As a result, a method that looks profitable on paper may only break even in live trading.
Third, opacity is a real concern. Some tools show a score without explaining what drives it. Ideally, you should know the main inputs, the testing period and how the results were validated.
Fourth, psychology can work against you. A high score may tempt traders to oversize a position or skip a stop. Ironically, the confidence meant to reduce risk can end up increasing it.
To stay grounded, treat the score as one input in a broader process. Paper trade before going live, and review performance on a regular schedule. Above all, never risk money you cannot afford to lose. Trading involves substantial risk, and past performance does not guarantee future results.
Final Thoughts
Confidence rating signals turn raw alerts into ranked opportunities. They combine trading signal strength, historical outcomes and the logic of confluence trading into one readable number. Used well, they help you filter noise, size positions sensibly and stay consistent. Used carelessly, however, they can create overconfidence.
The best approach is a balanced one. Understand how the score is built, test it against your own results, and keep strict risk rules in place no matter what the model says.
When you compare tools that offer scored signals, apply the same scrutiny to each one. For example, traders researching GainzAlgo often start by asking "is GainzAlgo legit", and that is a healthy question to ask of any provider. Look for a clear explanation of methodology, realistic performance data that includes losing streaks, and plain risk disclosures. Ultimately, any scoring tool earns trust through openness and consistent behavior over time, not through bold claims.